To view previous Objective click, HERE.
Objective Topics:
- Monitor status of the vCenter Server service
- Perform basic maintenance of a vCenter Server database
- Monitor status of ESXi management agents
- Determine ESXi Host stability issues and gather diagnostics information
- Monitor ESXi system health
- Locate and analyze vCenter Server and ESXi logs
- Determine the appropriate Command Line Interface (CLI) command for a given troubleshooting task
- Troubleshoot common issues, including:
- vCenter Server service
- SSO
- vCenter Server connectivity
- Virtual machine resource contention, configuration and operation
- Platform Services Controller (PSC)
- Problems with installation
- VMware Tools installation
- Fault Tolerant network latency
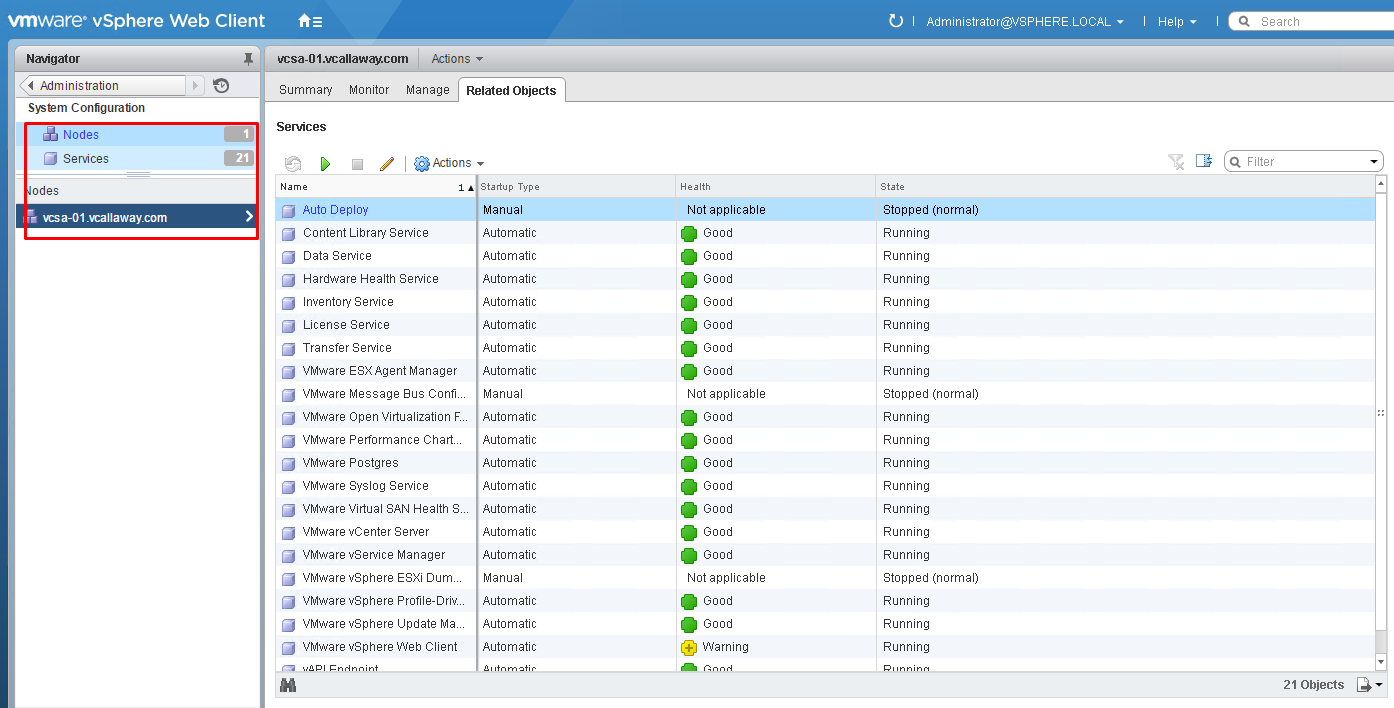
Monitor status of the vCenter Server Service
Administration > System Configuration > Nodes (vCenter) > Related Objects tab
Perform basic maintenance of a vCenter Server Database
Helpful Database Maintenance Tips
Monitor scheduled database jobs to ensure they’re running correctly.
- Collect statistics
- Rebuild indexes
- Delete old data
- Monitor Database growth
Source: VMware Tips
Monitor status of ESXi Management Agents
Restart Management Agents using (DCUI)
- Connect to console of ESXi Host
- Press F2
- Login as root
- Navigate to Troubleshooting Options ? Restart Management Agents
- Press Enter
- Press F11 to restart the services
- When service restarts, press Enter
- Press Esc to logout.
Restart Management Agent using shell/ssh
- Login to ESXi Shell or SSH as root.
- Restart ESXi host daemon and vCenter Agent services
- /etc/init.d/hostd restart
- /etc/init.d/vpxa restart
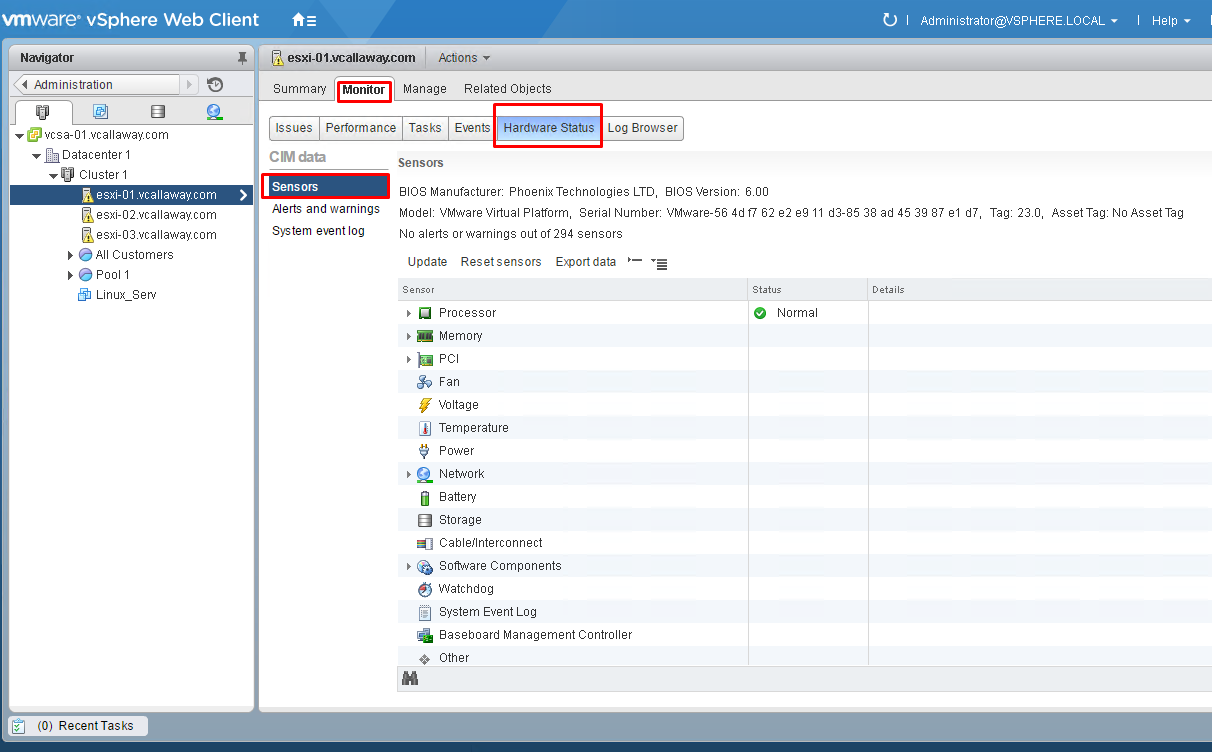
Monitor ESXi System Health
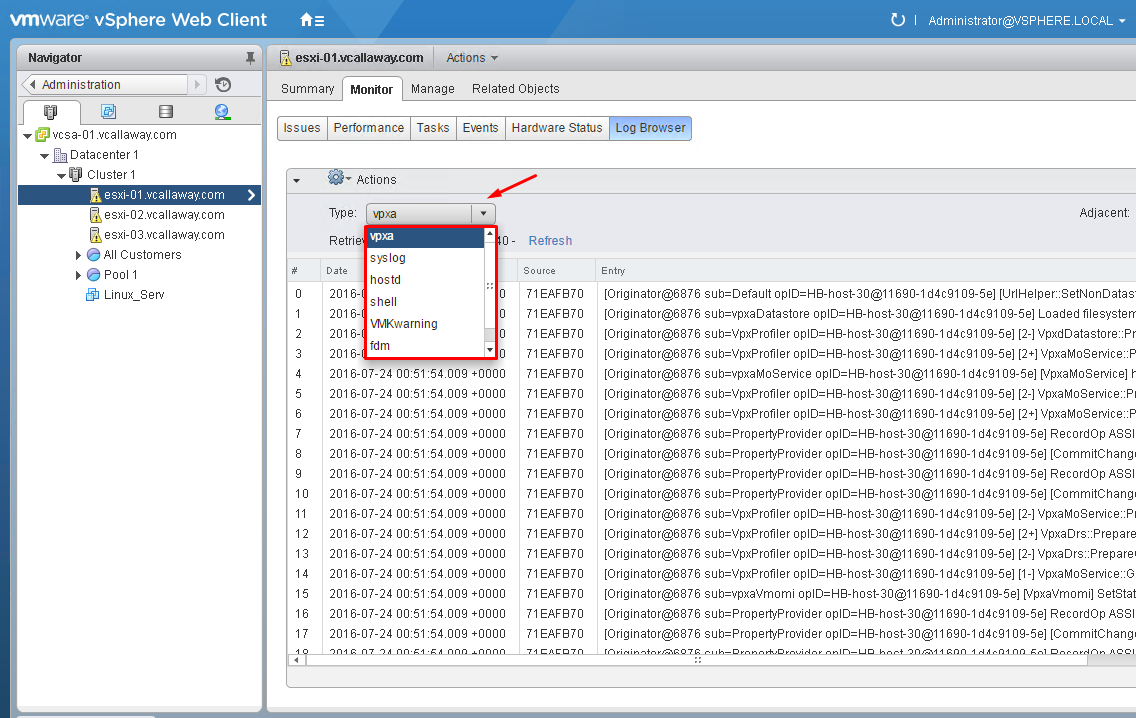
Local and Analyze vCenter Server and ESXi Logs
- vCenter running on windows the log files will be located in C:\ProgramData\VMware\VMware VirtualCenter\Logs
- vCenter running on virtual appliance the log files will be located in /var/log/vmware/vpx
vpxd.log
The main vCenter Server log, consisting of all vSphere Client and WebServices connections, internal tasks and events, and communication with the vCenter Server Agent (vpxa) on managed ESXi/ESX hosts.
vpxd-profiler.log
Profiled metrics for operations performed in vCenter Server. Used by the VPX Operational Dashboard (VOD) accessible at https://VCHostnameOrIPAddress/vod/index.html.
vpxd-alert.log
Non-fatal information logged about the vpxd process.
cim-diag.log and vws.log
Common Information Model monitoring information, including communication between vCenter Server and managed hosts’ CIM interface.
drmdump
Actions proposed and taken by VMware Distributed Resource Scheduler (DRS), grouped by the DRS-enabled cluster managed by vCenter Server. These logs are compressed.
ls.log
Health reports for the Licensing Services extension, connectivity logs to vCenter Server.
vimtool.log
Dump of string used during the installation of vCenter Server with hashed information for DNS, username and output for JDBC creation.
stats.log
Provides information about the historical performance data collection from the ESXi/ESX hosts
sms.log
Health reports for the Storage Monitoring Service extension, connectivity logs to vCenter Server, the vCenter Server database and the xDB for vCenter Inventory Service
eam.log
Health reports for the ESX Agent Monitor extension, connectivity logs to vCenter Server
catalina.date.log
Connectivity information and status of the VMware Webmanagement Services.
jointool.log
Health status of the VMwareVCMSDS service and individual ADAM database objects, internal tasks and events, and replication logs between linked-mode vCenter Servers
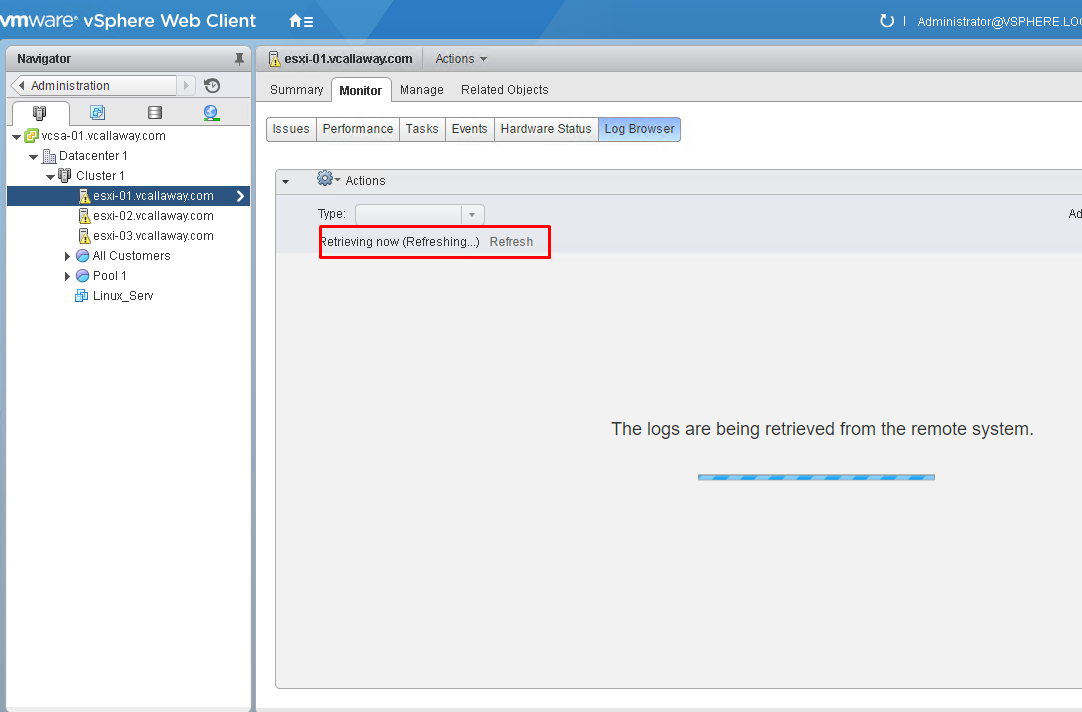
To view the logs in the Web Client.
You may need to refresh or retrieve the logs. See below.
Troubleshoot Common Issues:
From Blueprint:
- vCenter Server service – KB Article
- SSO – KB Article
- vCenter Server connectivity – KB Article
- Virtual machine resource contention, configuration and operation – KB Article
- Platform Services Controller (PSC) – KB Article
- VMware Tools installation – KB Article
- Fault Tolerant network latency – KB Article


