To view previous Objective click, HERE.
Objective Topics:
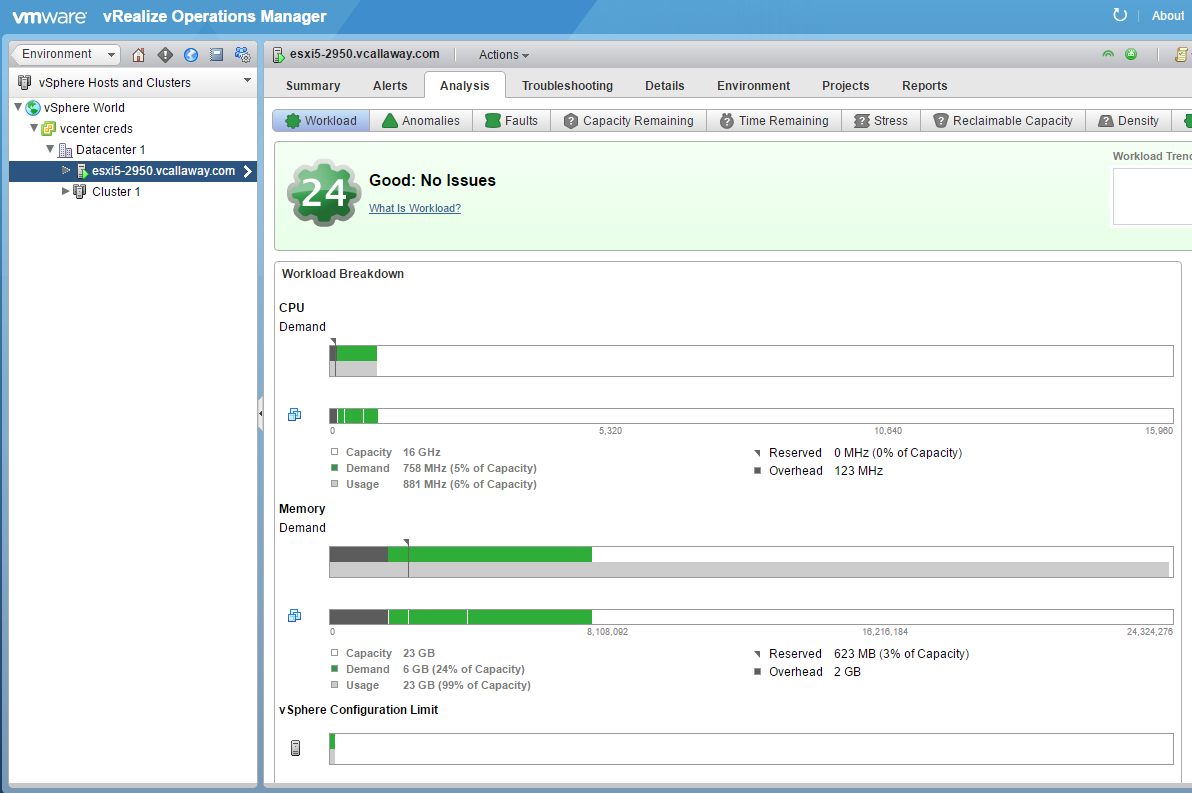
- Monitor CPU and memory usage (including vRealize OM badges and alerts)
- Identify and isolate CPU and memory contention issues
- Recognize impact of using CPU/memory limits, reservations and shares
- Describe and differentiate critical performance metrics
- Describe and differentiate common metrics, including:
- Memory
- CPU
- Network
- Storage
- Monitor performance through esxtop
- Troubleshoot Enhanced vMotion Compatibility (EVC) issues
- Troubleshoot virtual machine performance with vRealize Operations
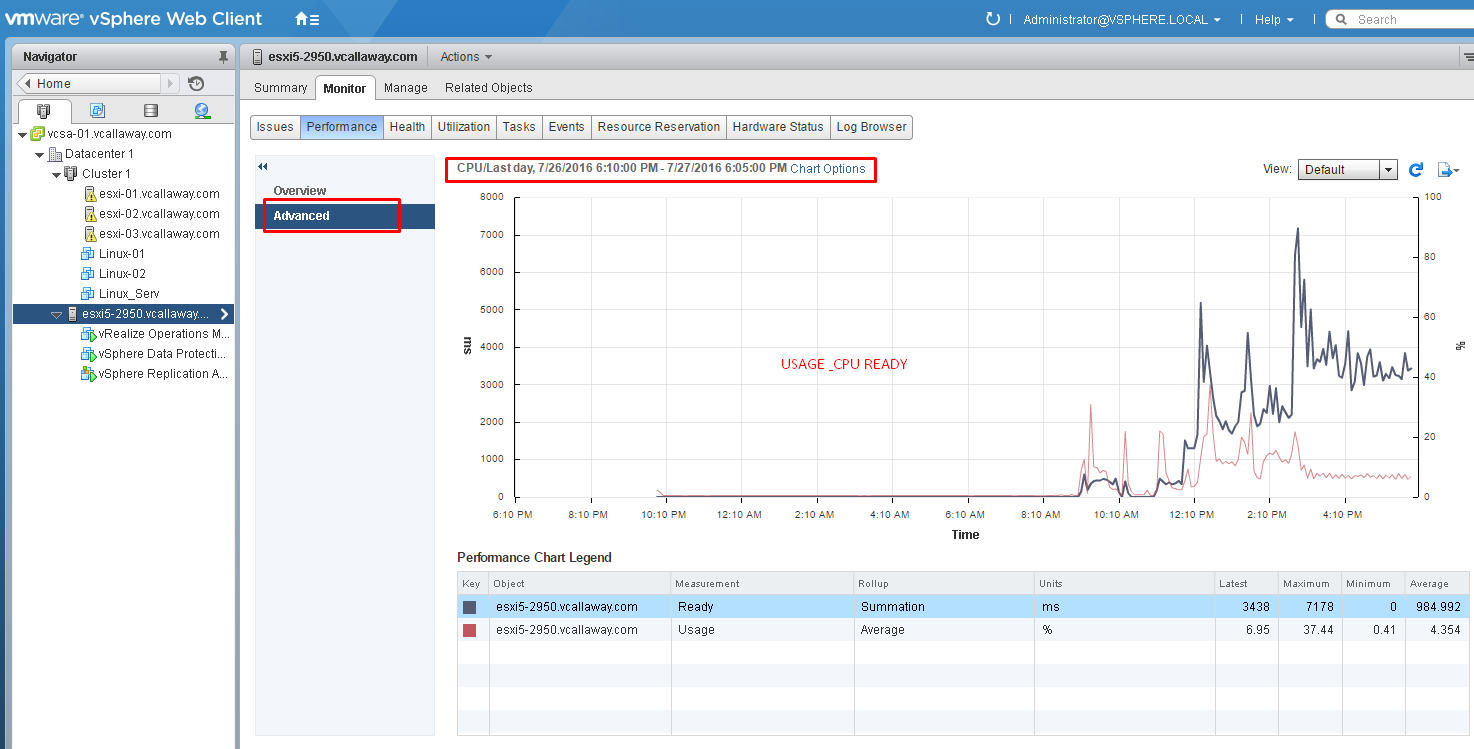
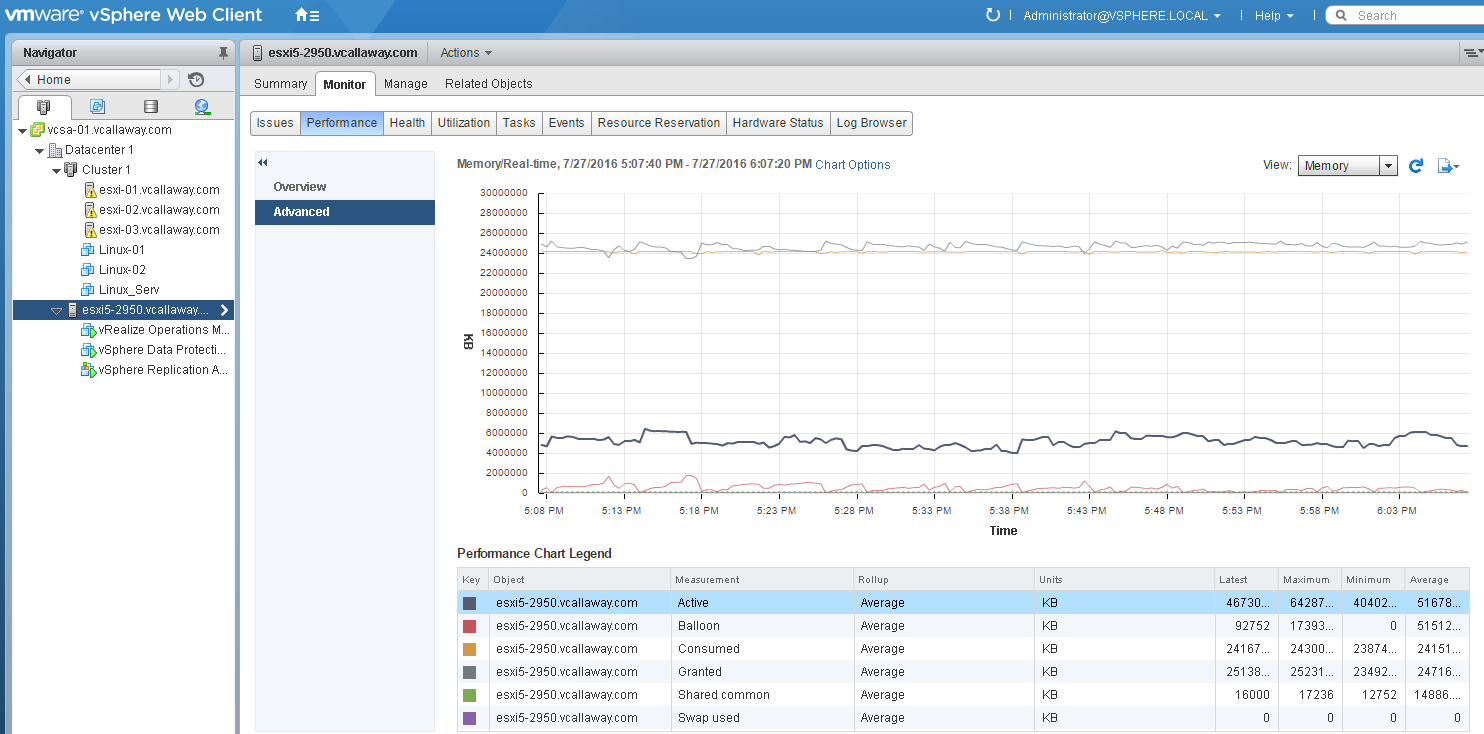
- Compare and contrast Overview and Advanced Charts
Monitor CPU and Memory Usage
Not exactly what they’re wanting here other than to be aware of where to find the computer metrics on performance and utilization.
Web Client
vRealize Operations Manager (freshly installed)
Compare/Contrast Overview and Advanced Charts
Overview is what I like to think of as the 10,000 foot view. Overview/high level of the different compute, network, storage metrics that make up a host, VM, etc…
Advanced is what you’d use to be able to look at historical data, drill down into specific metrics per resource, VM, host, etc…
Monitor performance through ESXTOP
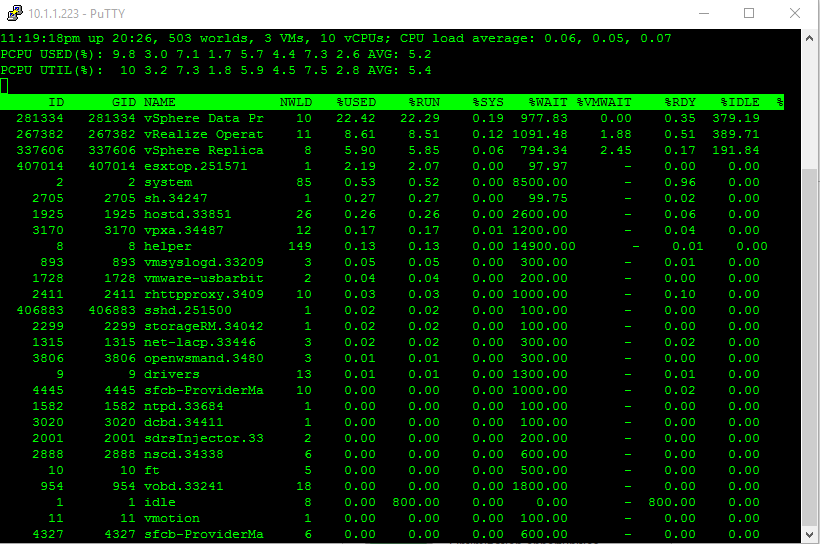
To view performance data via ESXTOP, we’ll need to SSH (using putty) into one of our hosts.
Once logged in, issue the command ‘esxtop’, press enter. See below.
This is great, but what do we do with all this data?
Let’s start by cleaning it up and organizing it based on what we want to see.
Let’s just look at VM’s only. Input a ‘V’ (no quotes).
Lets see CPU statistics for my VM’s. Input a ‘c’ (no quotes).
How about memory statistics for my VM’s. Input a ‘m’ (no quotes).
Or device adapters. Input ‘d’.
Or network adapters. Input ‘n’.
So what does it all mean? I’ll provide the basics but there are some really good resources online that I’ll link to to explain more in depth than what I’ll do for this lab.
CPU
%RUN – Percentage of CPU time used (High %run means a vm is using lots of CPU resources)
%SYS – Percent of time used by system services (1 or more VM’s is operating heavy I/O).
%WAIT – Waiting time for CPU resources, including I/O wait, idle wait, others (High could mean nothing, because wait includes wait.
%VMWAIT – %VMWAIT = %WAIT – %IDLE (High %VMWAIT can indicate resource latency.
%RDY – Percentage of time a group was ready to run, but was not provided CPU resources. (High RDY can mean a deliberate resource constraint is preventing access to the CPU.
MEMORY
MCTL – Is the memory balloon driver installed?
MCTLSZ – Amount of physical memory reclaimed from VM or resource pool via ballooning
MCTLTGT – Amount of physical memory attempted to be reclaimed from VM or RP by ballooning
MCTLMAX – Max amount of physical memory that can be reclaimed by ballooning
SWCUR – Current Swap Usage (high means guest physical memory has been moved from RAM to disk)
SWTGT – VMware target swap usage
SWR/s – Rate at which memory is being swapped IN from disk (high – indicate poor VM perf when VM needs those swapped mem pages
SWW/s – Rate at which memory is being swapped OUT to disk (high – indicate memory resource contention, either out of ram or deliberate resource constraint (limit/reservations).
NETWORK
PKTTX/s – packets per seconds
MBTX/s – Megabit per second
%DRPTX – % dropped packets transmitted
%DRPRX – % dropped packets received
STORAGE
CMDS/s – Number of commands issued per second.
READS/s – Number of read commands issued per second.
WRITES/s – Number of write commands issued per second.
MBREAD/s – MB reads per second.
MBWRTN/s – MB written per second.
DAVG/cmd – AVG responses time between host HBA and storage device per storage command – high number insufficient storage HW
KAVG/cmd – AVG responses time from VMkernel for storage commands – 0> mean latency due to the ESX Kernel’s command
GAVG/cmd – sum of DAVG and KAVG
QAVG/cmd – average queue latency – 0> mean latency
Here is a great chart that tells you everything you need to know about using ESXTOP.
vSphere 6 ESXTOP quick Overview for Troubleshooting Chart


